
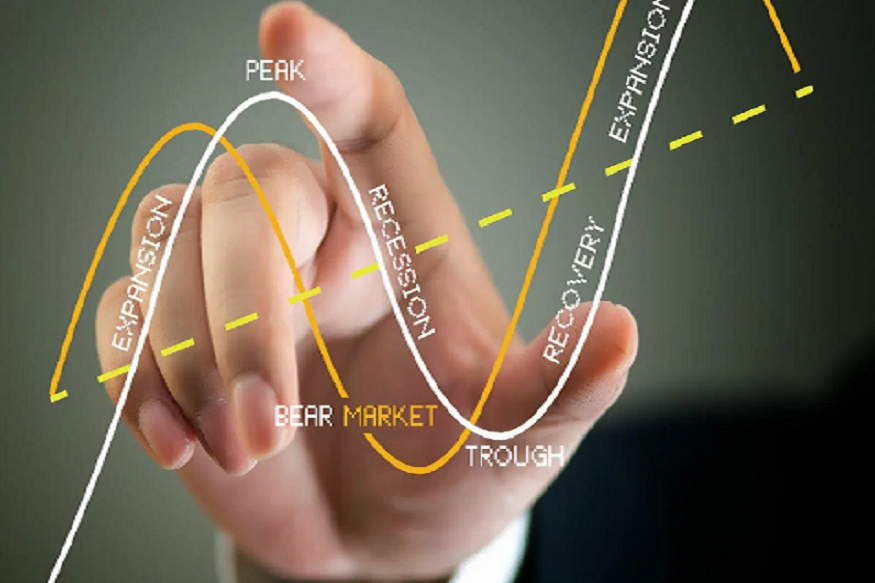
The stock market is often described as a roller coaster ride, filled with highs and lows that seem unpredictable. However, the truth is that stock markets generally follow discernible cycles, with patterns that can offer valuable insights for investors. Understanding these cycles is crucial for making informed decisions about when to buy and sell. By analyzing stock market cycles, investors can enhance their ability to navigate market fluctuations, minimize risks, and maximize returns.
To learn more about stock trading and investing, you can visit BG Saxo.
Tools and Techniques for Identifying Market Cycles
Accurately identifying stock market cycles requires a combination of technical analysis, fundamental analysis, and sentiment indicators. Each method offers a unique perspective, and together, they form a comprehensive toolkit for navigating market cycles.
Technical Analysis Tools
Technical analysis focuses on price movements and volume to predict future market trends. Here are some key tools used to identify market cycles:
- Moving Averages: Moving averages smooth out price data to help identify trends over time. The 50-day and 200-day moving averages are especially popular for spotting long-term trends. A “golden cross” (when the 50-day moving average crosses above the 200-day) is often seen as a bullish signal, while a “death cross” (when the 50-day crosses below the 200-day) signals bearish conditions.
- Bollinger Bands: Bollinger Bands help investors identify volatility and overbought or oversold conditions. When the price moves beyond the upper or lower bands, it may signal the start of a new trend or a reversal.
- Relative Strength Index (RSI): The RSI measures the speed and change of price movements. Values above 70 typically indicate that a stock is overbought, while values below 30 suggest it is oversold, often signaling potential market turning points.
Fundamental Analysis Indicators
While technical analysis offers short-term signals, fundamental analysis focuses on the financial health of a company and the broader economy. Key indicators include:
- Price-to-Earnings (P/E) Ratio: A high P/E ratio can indicate overvaluation, while a low P/E ratio might suggest undervaluation. Investors often look for cyclical shifts in P/E ratios as signs of potential market corrections or recoveries.
- Economic Data: Key economic reports such as GDP growth, unemployment rates, and inflation can offer clues about the broader market cycle. For example, a period of low unemployment and strong GDP growth might signal the early stages of a market expansion.
Sentiment Indicators
Investor sentiment plays a huge role in determining the market’s direction. Some valuable sentiment indicators include:
- Volatility Index (VIX): Often referred to as the “fear gauge,” the VIX measures market volatility expectations. A rising VIX typically suggests fear and uncertainty, which often precedes a market downturn, while a falling VIX signals confidence and stability.
- Investor Sentiment Surveys: Surveys like the AAII Sentiment Survey gauge the mood of individual investors. Extreme levels of optimism or pessimism can be contrarian signals, meaning that overly bullish sentiment often marks the peak of a market, while overly bearish sentiment can indicate a market bottom.
When to Buy: Identifying Opportunities in Market Cycles
The accumulation phase is typically characterized by lower prices and a general sense of market pessimism. This phase often occurs after a significant market downturn. While it may seem counterintuitive, this is often the ideal time to buy for long-term investors.
- Key Indicators: Look for signs of stabilizing prices, low trading volumes (indicating lack of interest from the general public), and positive divergence between price and indicators like RSI or MACD (Moving Average Convergence Divergence). This suggests that strong hands (institutional investors) are accumulating shares at undervalued levels.
Key Indicators of a Bullish Trend
Once the market moves into the markup phase, prices begin to rise steadily, fueled by growing optimism and increasing investor confidence. Positive earnings reports, low interest rates, and favorable macroeconomic conditions can propel the market higher.
- Technical Signals: Look for breakouts above resistance levels, rising moving averages, and increasing volume. These signals suggest that the bull market is gaining strength.
When to Sell: Recognizing When the Market Cycle Has Shifted
The distribution phase marks the end of a bull market. During this phase, prices stagnate or start to fluctuate, and market participants are beginning to realize that the market is near its peak. Institutional investors typically start unloading stocks during this phase, as they take profits from the rally.
- Key Indicators: Look for weakening earnings, diminishing volume during rallies, and bearish reversal patterns (like head and shoulders). These are signs that the market is nearing the top and may be ready to enter the markdown phase.
A bearish trend begins during the markdown phase, where prices fall rapidly as market sentiment shifts from optimism to pessimism. Key indicators of a bearish market include declining corporate earnings, rising interest rates, and a reduction in consumer spending.
- Technical Signals: Look for breakdowns below key support levels, increasing volatility, and bearish technical patterns like descending moving averages.
Conclusion
Understanding stock market cycles is a powerful tool for making informed decisions about when to buy and sell. By using a combination of technical and fundamental analysis, as well as staying attuned to investor sentiment, you can better navigate the ups and downs of the market. Whether you’re a long-term investor or a short-term trader, having a firm grasp on market cycles can help you minimize risks, maximize returns, and achieve greater success in the stock market.